Interpreting Results
DISCLAIMER: Medical care of patients with epilepsy is a
complex task that requires integration of numerous different test results,
and multi-disciplinary collaboration among clinicians. Epilepsy diagnosis
and seizure localization should use all information available to the
clinician, and SPECT results are only one part of the diagnostic
evaluation, which need to be interpreted by the clinician in the broader
context of other data. The image analysis methods described on this
site are intended for research purposes, to enable the investigation of
how to best interpret SPECT results in epilepsy. The developers of this
web site, ISAS, and the Yale Epilepsy Research Group are not responsible
for clinical decisions made by others using SPECT results.
Summary of ISAS Interpretation
Details of ISAS interpretation are described in McNally et al., 2005.
In summary:
- For true ictal SPECT (i.e. SPECT injection performed before the end of the seizure), localization should be based on the location of a positive region showing CBF increases using the “Reading rules” below.
- For post-ictal SPECT (i.e. SPECT injection performed after the end of the seizure), localization cannot reliably be done, but the hemisphere of onset can be lateralized based on the hypoperfusion asymmetry index.
Reading Rules
Reading rules for interpretation of SPM SPECT analysis (taken from McNally, et al, 2005).
Criteria for interpreting SPM SPECT results were established aimed at identifying a single positive region whenever possible. The interpretation consisted of first identifying the most significant cluster of contiguous voxels, referred to as a “positive cluster.” Next, the region (lobe) identified by this cluster was identified, and referred to as a “positive region.” The following criteria were used:
- A cluster of voxels was considered positive if it was:
- Significant at the cluster level (corrected significance level p<0.05)
- Most significant at the cluster level (lowest corrected p value)
- Rules for ties: If the corrected cluster level significance P is <0.001 for more than one cluster, this can lead to apparent ties for the most significant cluster. This is because the SPM glass brain window for volume statistics rounds P values to 3 significant digits by default, yielding P values of “0.000.” The P values without rounding can be obtained by clicking on the “0.000” for each cluster. The P values without rounding will then appear in the Matlab command window, and can be used to determine the most significant cluster. In the case of truly tied P values, then both clusters were considered positive.
- A region (lobe) was considered positive if:
- It contained the majority of the voxels from a positive cluster.
- Rules for ties: If a positive cluster involved 2 or more regions equally, then all involved regions were considered positive.
Example Interpretation for Sample Patient
For the Sample Patient (patient #2 from McNally et al., 2005), the seizure duration was 153s,
and the injection took place 84s after seizure onset (69s before seizure end), so this was a true ictal injection.
- Therefore, the localization should be based on CBF increases using the "Reading rules" above.
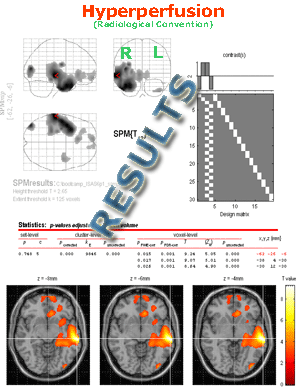
According to the glass brain and SPM statistics for Hyperperfusion in the Sample Patient, there was one cluster with corrected cluster level significance p<0.05,
and this was also the most significant cluster (corrected cluster level significance P="0.000" in the statistics table). To review these results more closely refer to the sample analysis page.
In the SPM glass brain window, the lobe containing the majority of the hyperperfusion voxels for the most significant cluster was located in the right temporal lobe.
- To determine this information you can click on the coordinates of the most significant cluster in the statistics table,
and the cursor will move to the corresponding cluster on the glass brain display. Based on the glass brain, as well as the coronal sections and 3Ds (and Rview),
the majority of the voxels for the most significant cluster in the Sample Patient are located in the right temporal lobe.
Therefore, the localization based on ISAS for this patient is in the right temporal lobe.

Back to Using Rview
||
Jump to Top
||
Forward to Hypo-Asymm. Index


